Tag: obamacare
Obamacare Battle
by Jitesh Gandhi on Jun.08, 2013, under Politics
As we approach January 1, 2014, the big parts of the Patient Protection and Affordable Care Act (a.k.a. PPACA, ACA or Obamacare) are going to go into effect. Over the next couple of months, states will be getting their health exchanges set up for open enrollment in October. As this happens, we’re getting alternating announcements about how rates will be going up or down (or not—I will return to this specific analysis later). Since this is more about a political battle (not so much ideological in my opinion), we should expect to see these headlines declaring Obamacare a loser and winner for the foreseeable future.
I can’t think of any politician who was against the need for health care reform. Sadly, it was pushed through by one party with the other party now 100% against it. There’s a good write-up on the Wonkbook about where this road is likely to lead. The goal in Washington, DC now isn’t to focus on reforming health care for the better, but to win the next election through a “winner” take all approach. Just get the message out there, regardless of the facts to win the battle. The public isn’t fully informed about this law while it will impact nearly everyone.
Obamacare is what we have. We should think of it as a starting step. There’s going to be some good and some bad. We should keep the good, learn lessons from the bad and improve it. Healthcare is too big to fix with one reform. I also think anyone who “knows” what is going to happen is just hoping that will happen. All these predictions on the success and failure of Obamacare are absurd–the law is entirely too big to succeed or fail as a whole.
Getting back to the health exchanges, people are comparing premiums in 2014 to premiums in 2013 to determine if health care costs fell or went up. The exchanges are designed for the individual market which is going to have the largest impact. By law, everyone must have health insurance in 2014. If they do not, they will have to pay a penalty under most circumstances. They can no longer deny coverage to someone who may be high risk.
Now, every insurance company is trying to predict how many people who previously chose not to have insurance will choose to get insurance or pay a penalty. The penalty in 2014 (1% of income or $95/adult and $47.50/child, whichever is greater) is significantly lower than the annual premium will be. For each person/family that is uninsured, there will be an inflection point where the value of the insurance outweighs the penalty and vice versa.
The insurance companies must also account for all the people who they were able to deny in the past who are now eligible. Those people are more likely to spend more than they pay in premiums. They’ve hired experts to try and figure this out, but the reality is, they have no previous data to gauge this. They also cannot change the premiums for 2014 once set. Some will get this right, others wrong. If they are wrong, one of two things happen. If they didn’t collect enough premiums, it’s their problem and if they collected too much (did not spend 80% on medical services), they will have to issue a rebate. Personally, I’d rather hit it right or issue a rebate than take a loss. It’s for this reason I think it will be interesting to see what happens with rebates for 2014.
There still won’t be stability in 2015. The penalty changes to 2% of income or $325/adult and $162.50/child. Same thing happens in 2016 with a change to 2.5% of income or $695/adult and $347.50/child. It stays this way going forward. I think following this, we will see what rates really will look like. They should have the data necessary to predict who joins and who takes the penalty. Until then, the individual rates are a snap judgment. We should continue to look toward the group rates for comparisons in the meantime. (Note that group rates are the same regardless of age. The variation is based on the number of people enrolling. So when comparing individual to group, that needs to be accounted for as well.)
Finally, the Forbes article mentioned before. In his quest to prove his colleague wrong, he did his own analysis. He called California’s comparison apples and oranges (it was), but then proceeded to compare his own apples and oranges. He compared 2013 individual rates to 2014 individual rates. As I mentioned above, the pool of customers is going to change drastically. I don’t think you can really compare them to anything to determine if the rates are better or worse. I’d say they are competitive at a minimum. Most employer plans (group) accept employees with pre-existing conditions. In 2014, individual plans will have to do the same. Those plans should have much larger groups than small businesses, so there is more people to spread the risk across, but the big question is how is the pool going to be comprised?
In his comparison he still cherry picked the data. He first said he took the average price from Covered CA and immediately said it was the Median across the state instead. He did not explain if that was all plans, the cheapest plan, most expensive plan, median plan or average plan in each region. He also did not say where the eHealthInsurance was from as you have to provide a zip code. I used Santa Clara and got 52 plans. To support his position that “Liberals” are wrong, he used the median for the cheapest 5 in his “analysis”.
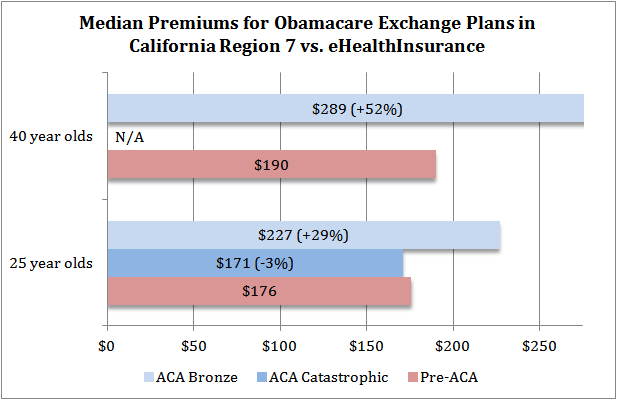
Let’s try to do a more honest analysis first. I’m using Region 7 (picked “randomly”, I didn’t use a number generator, I just chose a number). It is Santa Clara. They have 5 catastrophic plans with the following prices for 25 year olds: $171, $169, $147, $228 and $225 (Average: $188, Median: $171). So what is a catastrophic plan? Loosely, it has a high deductible and you get 3 doctor visits before the deductible applies. So finding plans that waive the deductable for the first 3 visits and has a deductable over $5000 on eHealthInsurance: $202, $118 and $176 (Average: $165, Median: $176). 2013 plans have the cheaper option, but average and median aren’t so far apart. The writer did not even compare similar plans. He simply chose the 3rd cheapest plan from a list of 50+ while choosing the middle value for the state plans.
Re-creating his chart:
He probably wouldn’t want to use this one. -3% and +29% when “upgrading” to the Bronze coverage for 25 year olds (vs. his +100% and +123%. +52% for 40 year olds (vs. his 116%).
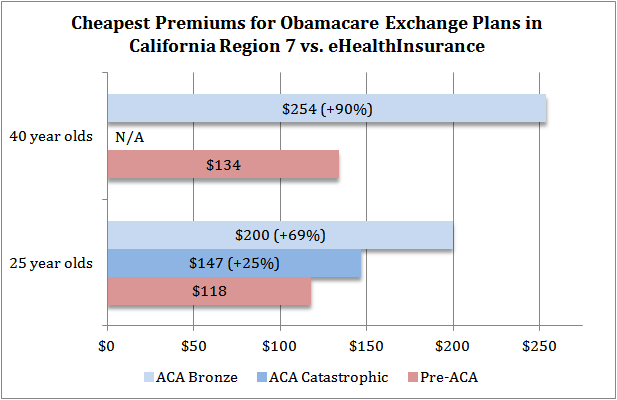
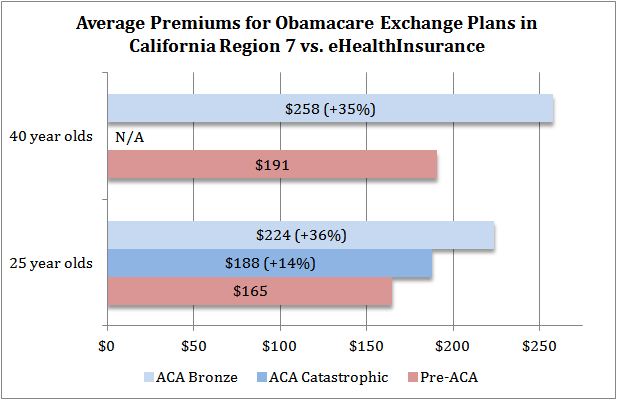
Other charts:
Cheapest would work a lot better for the argument. +25% and +69% when “upgrading” to the Bronze coverage for 25 year olds. +90% for 40 year olds.
Finally average (I don’t mean median). +14% and +36% when “upgrading” to the Bronze coverage for 25 year olds. +35% for 40 year olds.
If you didn’t decide TL;DR (or maybe if you skipped to the bottom), my opinion is it’s pointless to declare 2014 rates better or worse because there isn’t a baseline yet. It does however appear from this example people buying in the individual insurance market are likely looking at higher premiums than 2013. One thing to determine is if the coverage is better or worse.
One last note to data manipulators: If you’re trying to find favorable data, premiums for the young are likely to go up while premiums for the old are likely to go down. This is because there are provisions to limit premium variation by age. Given that the costs are higher the older the person and it is believed the cost ratio between youngest to oldest is higher than the limit, the math would require the lower number to come up the same amount the lower number comes down if there was an equal distribution by age until the new ratio was achieved. If the distribution is slanted toward the young, older customers will see a greater decrease than the increase to the young and vice versa.


 Facebook
 LinkedIn